Example board · Accounting
Cost-volume-profit and break-even
A revision board made in MySummaries for CPA review, shown as the app shows it in study mode. Updated 1 October 2026.
Highlights: the idea a number to know what to do, or the formula a trap
BAR: Business Analysis and ReportingCost-volume-profit and break-even12 sections · 3 columns
From zero to 10,000 units
| Units sold | Sales at $50 | Variable costs at $30 | Contribution margin | Fixed costs | Operating income |
|---|---|---|---|---|---|
| 0 | $0 | $0 | $0 | $120,000 | ($120,000), the whole fixed cost |
| 2,000 | $100,000 | $60,000 | $40,000 | $120,000 | ($80,000) |
| 4,000 | $200,000 | $120,000 | $80,000 | $120,000 | ($40,000) |
| 6,000 | $300,000 | $180,000 | $120,000 | $120,000 | $0, break-even |
| 8,000 | $400,000 | $240,000 | $160,000 | $120,000 | $40,000 |
| 10,000 | $500,000 | $300,000 | $200,000 | $120,000 | $80,000 |
Contribution margin
- Contribution margin = sales − variable costs: what each unit adds toward fixed costs, then profit
- Per unit: $50 − $30 = $20
- CM ratio = CM ÷ price: 40%, so the variable-cost ratio is 60%
- Past break-even, each unit adds its whole CM to operating income
More than one product
- Use a weighted-average CM, weighted by the sales mix in units
- A ($20 CM) and B ($40), sold 2 : 1: a package of 2 A + 1 B earns $80
- $120,000 ÷ $80 = 1,500 packages: 3,000 A and 1,500 B
- A new mix moves the break-even: at 1 : 2 it is 1,200 A and 2,400 B, 3,600 units in all
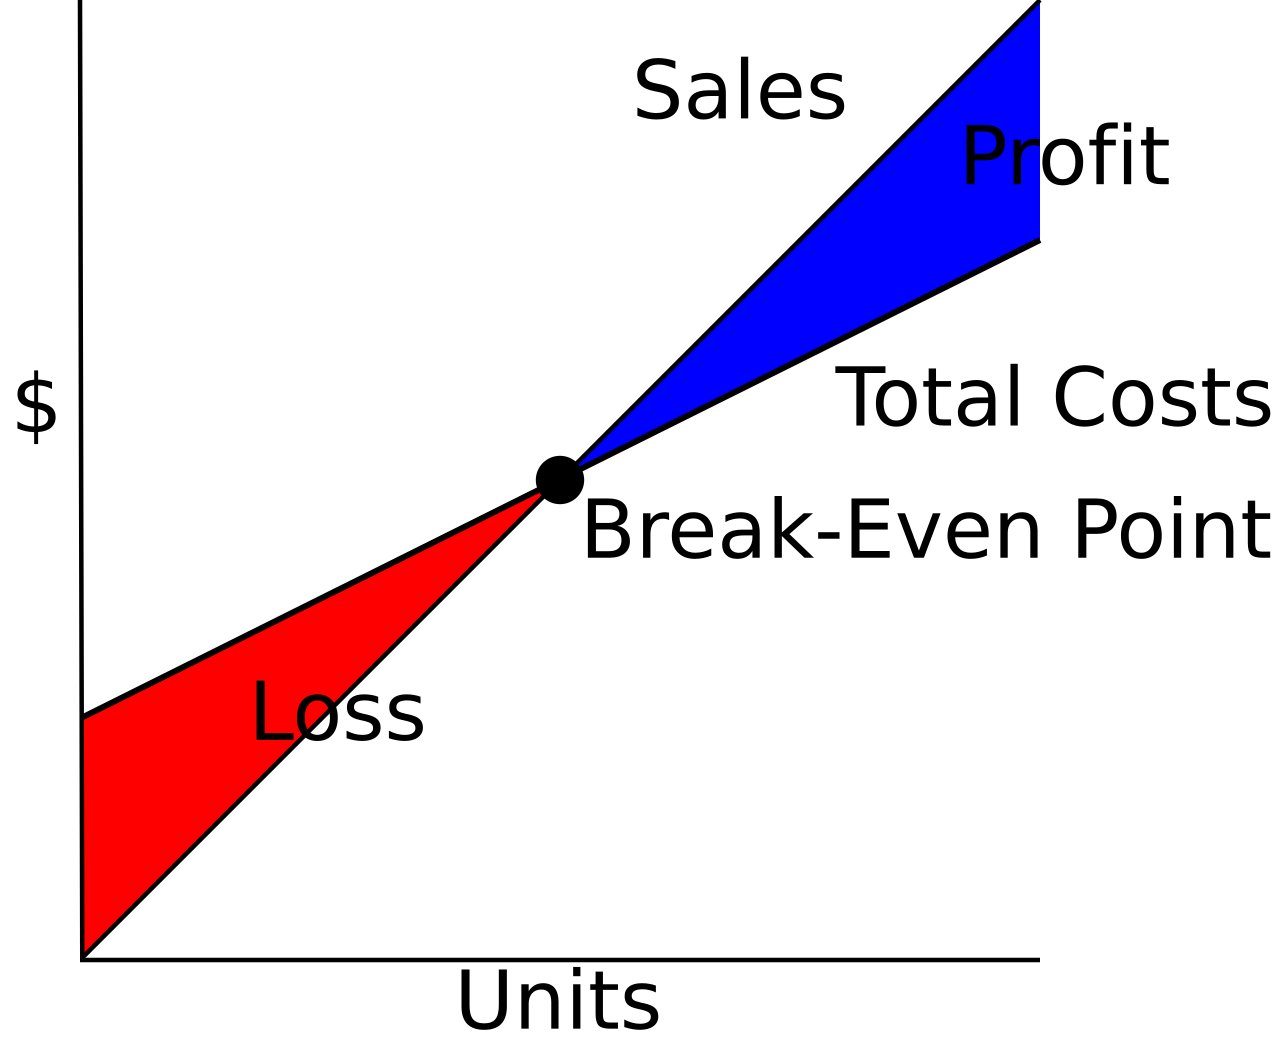
Reading the chart
- Total-cost line: starts at fixed costs; its slope is the variable cost per unit
- Sales line: starts at zero; its slope is the price
- Where they cross: break-even
- The gap between them: operating income above it, loss below
- Profit–volume graph: starts at −fixed costs, with CM per unit as its slope
Splitting a mixed cost: high-low
- Pick the highest and lowest activity, not the highest and lowest cost
- Variable rate = change in cost ÷ change in activity
- ($58,000 − $42,000) ÷ (10,000 − 6,000 hours) = $4 an hour
- Fixed: $58,000 − 10,000 × $4 = $18,000 a month
The break-even chart

Operating leverage
- DOL = contribution margin ÷ operating income
- At 8,000 units: $160,000 ÷ $40,000 = 4
- Sales up 10%, operating income up 40%
- DOL = 1 ÷ margin-of-safety ratio: 1 ÷ 25% = 4
- High fixed costs mean high DOL: it works the same way down
What moves the break-even
- Price down 10%, to $45: CM $15, so break-even is 8,000 units, up 33%
- Fixed costs up 10%: break-even up exactly 10%, to 6,600 units
- Variable cost up: CM down, break-even up
- A price cut needs much more volume than it looks
Break-even point
- Units = fixed costs ÷ CM per unit
- $120,000 ÷ $20 = 6,000 units
- Sales dollars = fixed costs ÷ CM ratio
- $120,000 ÷ 0.40 = $300,000
- At break-even the total CM exactly covers fixed costs
Target profit
- Units = (fixed costs + target operating income) ÷ CM per unit
- $60,000 target: ($120,000 + $60,000) ÷ $20 = 9,000 units
- After tax: gross the target up first, dividing by (1 − tax rate)
- $42,000 after 30% tax ÷ 0.7 = $60,000 before tax: the same 9,000 units
Margin of safety
- How far sales can fall before there is a loss
- Budgeted sales − break-even sales
- Budget 8,000 units: 2,000 units, or $100,000
- As a ratio: $100,000 ÷ $400,000 = 25%
Assumptions and traps
- Straight lines hold only within the relevant range
- Every cost splits into fixed and variable, and the sales mix holds
- CVP uses the contribution format, not the absorption-costing income statement
- If production and sales differ, fixed overhead in inventory moves absorption income away from the CVP answer
Make your own board. Build a board of your own from your notes, and MySummaries writes the flashcards, practice papers and audio lectures from it. Free plan: 20 cards, a paper, a lecture and a viva to try.
Make your own board